Phase MOSAIC contains many plots and views of calculated data. The types of data plots are described here. Each plot can control how its data is displayed:
![]()
![]()
The font used in the data plots may be changed by using the
View | Font menu item or the
 button.
The font can be changed with the font dialog box:
button.
The font can be changed with the font dialog box:
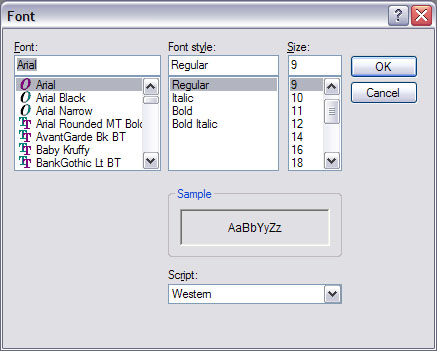
The font change will affect the displayed fonts in all plots and views.
Plots show data over fixed limits. These limits may be different than the total data extent. In order to easily expand or contract display limits in plots, Zoom menu items and buttons are provided. Right-click in the plot and choose the Zoom menu items. Zoom | Autoscale will set the limits to the data extents. Most views also provide Zoom functions through buttons on the main tool bar:

These buttons provide Zoom Autoscale, Zoom 200%, and Zoom 50% functionality with the main plot in the view. Shortcut keys Ctrl++ or Ctrl+- can also be used to Zoom In or Zoom Out, respectively.
Individual plot properties can be managed by right-clicking in the plot and choosing Properties menu items:
| Edit displays a tabbed dialog box in which the properties of the plot can be specified. Possible choices include plot limits, display styles, and data representations. Description of each plot type is shown here. |
| Save stores the properties as an XML formatted file for later use. This allows for many settings to be used in different plots. |
| Load retrieves properties previously stored using the Save command. |
| Restore can be used to return plot properties to their settings before their last modification. |