Various plots for representing data are used in Phase MOSAIC. Right clicking in the plot area will display a menu of options to change how the data is displayed and allow for the export of data to other applications via the clipboard. Here are examples of the various plot types:
![]()
![]()
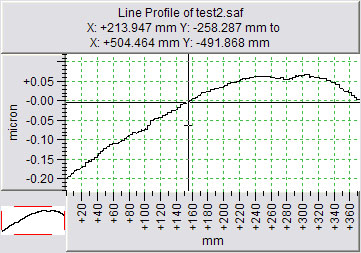
1D data plots
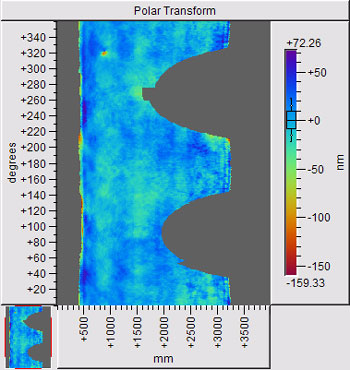
2D data plots
Text plots
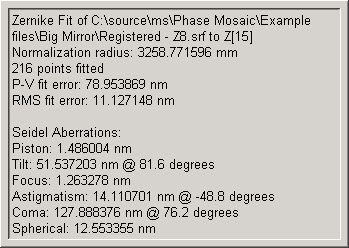
Text contained in a text plot can be copied to the clipboard. Right-click and select Copy Text. To copy the graphic version of the plot, select Copy Graphic. See Exporting - clipboard. If Properties is selected, 3D effects with or without the inset can be chosen.
See Also