False color palettes are used in Phase MOSAIC to represent height in surface plots. The false color palette can be chosen for 2D and 3D Surface plots in the Preferences dialog. Built-in palettes are provided as well as a custom setting. If Custom is selected, the Customize | button will be active.
![]()
![]()

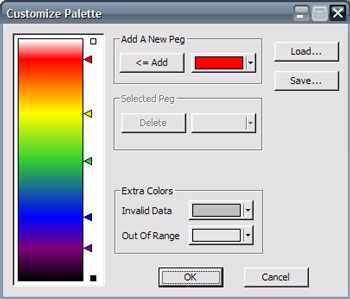
Custom palettes can be edited using the Cusomize Palette dialog:

Custom palettes are defined using a set of pegs that can be positioned within the palette range. Pegs are added by selecting a color using the filled color button and using the <= Add button. The pegs can be moved anywhere within the range by left-dragging with the mouse. Each peg's color can be edited by selecting the peg markers in the palette window on the left with the mouse and using the filled color button under Selected Peg. Extra colors used to represent invalid data pixels and data outside the plot limits are similarly set using the filled color buttons. When the desired palette is specified, the Save button will allow the edited palette to be saved to disk. Saved palettes can be restored using the Load button. Color palettes use the *.fcp extension. A selection of color palettes can be found in the Examples\color palettes directory.