The 2D Surface View
![]()
![]()
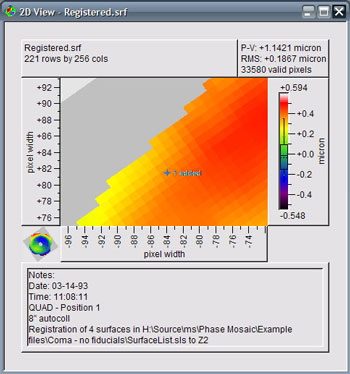
Cursor - A live crosshair cursor is activated by placing the cursor over the image area. Exact surface coordinates of the cursor is displayed on the status bar.
Zooming -The user can enlarge a selected area by left clicking and dragging the cursor to encompass the desired zoom area. As the cursor is dragged, the relative surface coordinates are also displayed on the status bar. Left clicking once in a zoomed surface view will return the full surface view.
Overview - The current zoom limits are represented in the overview image between the coordinate rulers.
Modiyfiying the palette - The user can change the color palette used to represent surface heights by right-clicking the image area and selecting Properties | Edit context menu, or using the View | Calculation Options | Edit menu item. See Calculation Options below.
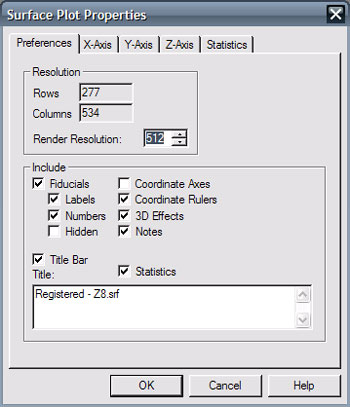
Image sampling - The resolution of the image representation of the surface can be changed using Properties | Edit context menu and changing the Render Resolution combobox on the Preferences tab. More resolution results in longer rendering times, whereas less resolution shows a blockier image. Best results are obtained where the resolution is chosen to be nearly the same as the width in pixels of the data to be viewed. This setting will affect all other open 2D surface views. See Calculation Options below.
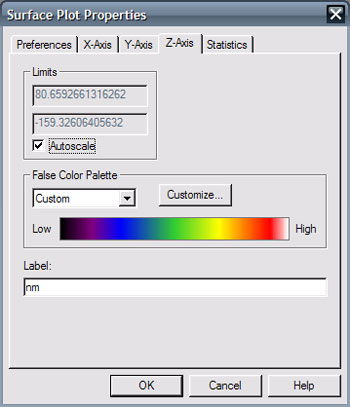
Modifying axis properties - Axis
properties may be modified by right clicking and selecting Properties | Edit. Individual
X, Y, and Z axes are modified separately in each axis tab. The user may define the limits
to display and the units to use. Limits can be edited directly or
autoscaled based on the extreme values in the data files by clicking in the autoscale
checkbox. Units can be changed by using either custom or predefined units
which are accessed with the units listbox. Custom units can be defined by entering
the size of the custom unit relative to the millimeter. The intrinsic unit
will use either pixel widths or mm, depending on if a distance scale has been defined.
(See Transform | Align | Scale | Fiducial Distance.) Intrinsic units have the same dimension independent of direction.
Units alone can be modified by using the  Units button on the main toolbar. See Units.
Eyedroppers - An alternate method of setting palette limits uses the eyedroppers located in the main tool bar. You may change either the minimum or maximum display unit value by clicking on the eyedropper then selecting the color within the surface display that represents the desired minimum or maximum display value. Data outside the proscribed limits will display as black. See Setting Display Limits.
File notes - File notes are displayed on the right side of the plot. File notes may be edited using the Notes menu which will then display the notes editor. See Notes Editor.
Adding fiducials - Fiducials may be added by right clicking with the mouse while the cross hairs are displayed on the active surface. Select the Add Fiducial Here menu item. The fiducial editor is then displayed to allow for any modification of the added fiducial. Clicking on the "+" node next to the fiducial group in the tree view will then display the individual fiducials. See also the Fiducial Editor.
Editing Fiducials - The fiducial editing window may be accessed on the menu bar under Fiducials. First select the group or fiducial you wish to edit then either click the Add, Delete or Edit button . You may modify the name of the group by selecting the group label or you may modify the values by selecting the fiducials themselves. See also the Fiducial Editor.
Translating Center - the coordinate system origin can be translated to any point in the display limits by right clicking an using the Translate Center Here menu item. See also the Transform | Align | Translate Origin | Arbitrary.
Image Export - The displayed surface representation can be saved as a Windows bitmap file. Right-click in the image area and select Save Rendered Image. Enter a file name for the exported file in the Save File dialog box.
Plot Statistics - Statistics of the sampled surface heights used in the plot are available under the Statistics tab. Peak, Valley, RMS, Median, Average, Standard Deviation, and number of valid pixels are given.
Selecting the calculation options button is equivalent to choosing View | Calculation Options | Edit. Here is where aspects of the data representation are chosen. None or partial details of fiducials can be displayed, coordinate axes can be displayed, the color palette is chosen, and rendering resolution is specified.