![]()
![]()
Histogram 
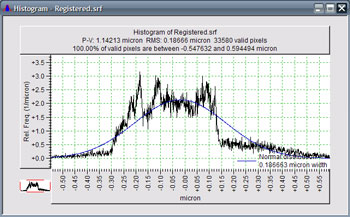
Histogram shows the distribution of surface heights sampled at every data point. This is displayed as a plot of relative frequency vs. surface height. The distribution is normalized so that the area under the curve over all values of surface height is equal to 1. The area between two surface height limits will be the fractional area of the surface having a height between the two limits. In order to allow the integral to represent fractional area, the units of relative frequency are inverse surface height units.
Calculation Options 
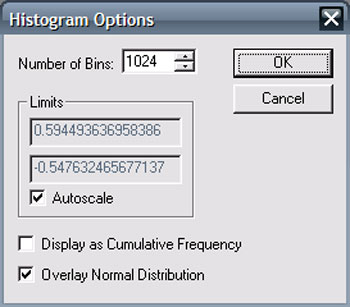
The number of bins can be specified. Less bins smooth the histogram.
Average