Phase analysis calculates surface results from an image list. By using a sequence of interferogram images with nominal 90 degree phase shift, various surface results can be calculated. Phase MOSAIC requires a minimum of 5 - 90 degree phase shifted images for phase calculations.
When two wavefronts are combined in an interferometer, an interference pattern is produced. The intensity at each pixel of an image is given by:

I is the average intensity value of both wavefronts, M is the fringe contrast or modulation, F is the phase difference between the two wavefronts, and q is an applied phase shift to produce the sequence of images. If q is 90 degrees and constant for every pixel, the phase difference can be calculated from the sequence of 5 images.
![]()
Full Version
Shift calculates the average phase shift that actually occurred between capturing the five images. The algorithm used is:
The phase shift is calculated at each pixel. In represents the intensity at the pixel location for the nth image in the list.
Modulation represents the amount of change of intensity at each pixel. The resulting surface is scaled to 1 and is calculated from the maximum and minimum intensity values found at each pixel location:
Wrapped phase calculates the phase at each pixel from the intensity at each pixel. A 5-bucket algorithm is used which requires 90 degree phase shifted images:
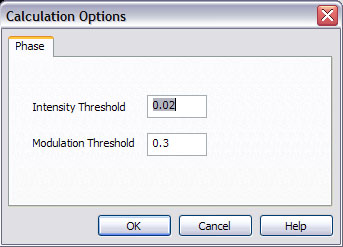
Pixels whose maximum intensity is not greater than the specified threshold or don't have sufficient modulation will not be calculated. Both threshold values are normalized to 1.
Unwrapped phase is similar to calculating Wrapped phase, however the 2 pi phase ambiguities are resolved by tile based phase unwrapping. The calculation options are the same as for Wrapped phase, with the addition of optionally specifying a mask. The mask can be used to remove spurious data which could cause unwrapping errors. See masking for details on using the mask tools.
Unwrapped surface scales the Unwrapped phase result to represent actual surface height. Each 2 pi phase interval represents one wavelength of optical path difference in an interferometer. By specifying the wavelength of light that produced the fringes and applying a wedge factor to relate surface height of the surface in question to the optical path difference, the surface height is displayed.