The Zernike Transform is a plot result used in Phase MOSAIC to graphically represent the composition of surfaces using Zernike polynomial components. The Zernike transform is similar to the Fourier transform in signal analysis. However, instead of plotting magnitudes of frequency components, the magnitude of the Zernike coefficients are plotted. The plot is two dimensional, and represents the coefficient as a false-color surface height.
![]()
![]()
Interpretation
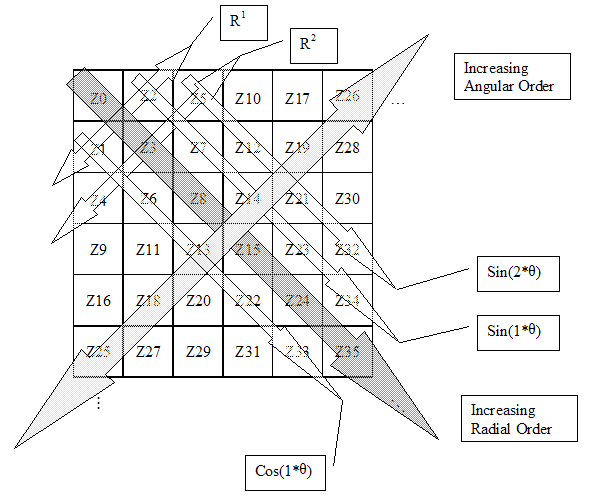
The coefficients are grouped in a particular order to make it easy to discern the angular and radial characteristics of the fitted surface. The upper-left corner contains the piston coefficient, Z0. Coefficients along the main diagonal represent pure radial structure. Lines parallel to the main diagonal represent various orders of angular symmetric structure based on the distance from the main diagonal. The diagonal row of values next to the main diagonal have 1-theta dependence, the next 2-theta, etc. Upper diagonal values have sine dependence on this angular function, lower diagonal have cosine dependence.
This helps to visually interpret surface characteristics easily.

Examples

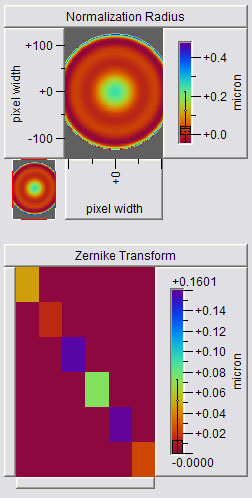
This transform shows a surface with only radial symmetric components. The large values far away from the upper left corner also shows that there are significant high order radial terms. These are due to the sharp edge turnover.

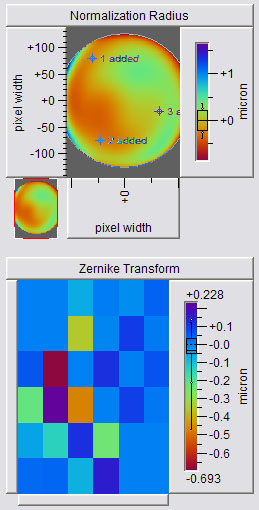
This transform shows only angular terms with significant low order values. This results from smoothly varying angular characteristics without any radial symmetry.